Multiple Choice
The diagram below shows an AD/AS model for a hypothetical economy.The economy begins in long-run equilibrium at point A. 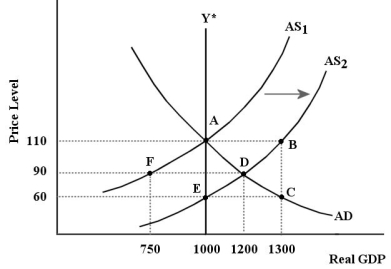 FIGURE 24-4
-Refer to Figure 24-4.After the positive aggregate supply shock shown in the diagram,which of the following would shift the AS curve leftward during the economy's adjustment process?
A) an increase in factor supplies
B) an increase in the unemployment rate
C) a decrease in wages and other factor prices
D) an increase in labour productivity
E) an increase in wages and other factor prices
Correct Answer:

Verified
Correct Answer:
Verified
Q24: In our macro model,the level of aggregate
Q25: The table below shows data for five
Q26: The diagram below shows an AD/AS model
Q28: The Phillips curve describes the relationship between<br>A)aggregate
Q31: <img src="https://d2lvgg3v3hfg70.cloudfront.net/TB5441/.jpg" alt=" FIGURE 24-2 -Refer
Q32: Income taxes in Canada can be considered
Q56: Consider the AD/AS model after factor prices
Q67: Suppose the government had made a decision
Q111: Suppose the economy begins in a long-run
Q130: In the basic AD/AS macro model,permanent increases