Multiple Choice
The table below shows data for five economies of similar size.Real GDP is measured in billions of dollars.Assume that potential output for each economy is $340 billion.
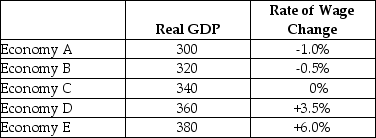 TABLE 24-1
-Refer to Table 24-1.Which of the following statements explains why wages are rising in Economy E?
A) The inflationary gap generates lower profits for firms because workers are demanding higher wages.
B) The inflationary gap generates excess demand for labour,which causes wages to rise.
C) The aggregate supply curve is shifting to the right,which is causing wages to rise.
D) The aggregate demand curve is shifting to the right,causing wages to rise.
E) Potential output is rising,putting upward pressure on wages.
Correct Answer:

Verified
Correct Answer:
Verified
Q21: <img src="https://d2lvgg3v3hfg70.cloudfront.net/TB5441/.jpg" alt=" FIGURE 24-1 -Refer
Q22: The diagram below shows an AD/AS model
Q23: Suppose that the economy is initially in
Q25: Suppose the economy is experiencing an inflationary
Q26: The diagram below shows an AD/AS model
Q28: The Phillips curve describes the relationship between<br>A)aggregate
Q29: The diagram below shows an AD/AS model
Q67: Suppose the government had made a decision
Q111: Suppose the economy begins in a long-run
Q130: In the basic AD/AS macro model,permanent increases