Multiple Choice
The diagram below shows an AD/AS model for a hypothetical economy.The economy begins in long-run equilibrium at point A. 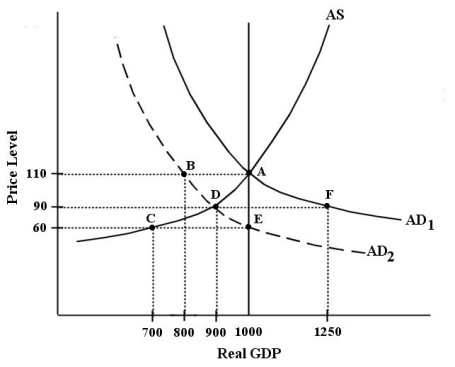 FIGURE 24-3
-Refer to Figure 24-3.A negative shock to the economy shifts the AD curve from  to
to  .At the new short-run equilibrium,the price level is ________ and real GDP is ________.
A) 90; 900
B) 110; 800
C) 60; 1000
D) 60; 700
E) 90; 1250
Correct Answer:

Verified
Correct Answer:
Verified
Q2: A recessionary output gap is characterized by<br>A)rising
Q7: The table below shows data for five
Q8: One advantage of using expansionary fiscal policy
Q11: <img src="https://d2lvgg3v3hfg70.cloudfront.net/TB5441/.jpg" alt=" FIGURE 24-1 -Refer
Q13: Suppose the economy is experiencing a significant
Q14: <img src="https://d2lvgg3v3hfg70.cloudfront.net/TB5441/.jpg" alt=" FIGURE 24-1 -Refer
Q15: Suppose Canada's economy is in a long-run
Q15: The diagram below shows an AD/AS model
Q64: Consider an AD/AS model in long-run equilibrium.An
Q76: Suppose Canada's economy is in a long-run