Multiple Choice
The diagram below shows an AD/AS model for a hypothetical economy.The economy begins in long-run equilibrium at point A. 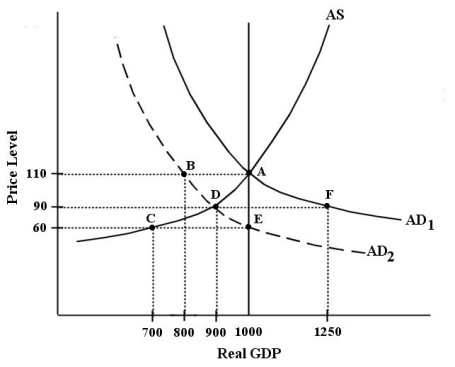 FIGURE 24-3
-Refer to Figure 24-3.After the negative aggregate demand shock shown in the diagram (from  to
to  ) ,which of the following describes the adjustment process that would return the economy to its long-run equilibrium?
A) Wages would eventually fall,causing the AD curve to shift to the right,returning to the original equilibrium at point A.
B) Wages would eventually fall,causing the AS curve to shift slowly to the right,reaching a new equilibrium at point E.
C) Wages would increase,causing the AS curve to shift to the right,reaching a new equilibrium at point E.
D) Wages would increase,causing the AD curve to shift to the right,returning to the original equilibrium at point A.
E) Potential output would decrease from 1000 to 900 and a new long-run equilibrium would be established at point D.
Correct Answer:

Verified
Correct Answer:
Verified
Q2: A recessionary output gap is characterized by<br>A)rising
Q10: The diagram below shows an AD/AS model
Q11: <img src="https://d2lvgg3v3hfg70.cloudfront.net/TB5441/.jpg" alt=" FIGURE 24-1 -Refer
Q13: Suppose the economy is experiencing a significant
Q14: <img src="https://d2lvgg3v3hfg70.cloudfront.net/TB5441/.jpg" alt=" FIGURE 24-1 -Refer
Q16: Which of the following is a defining
Q17: The diagram below shows an AD/AS model
Q19: When we study the adjustment process in
Q25: Suppose the economy is experiencing an inflationary
Q146: Which of the following would occur as