Multiple Choice
The table below shows real GDP,potential GDP and the unemployment rate for a hypothetical economy.
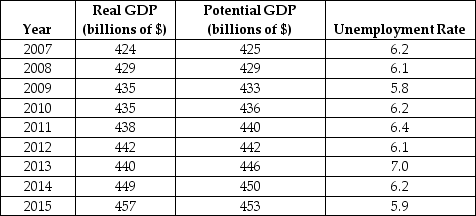 TABLE 30-3
-Refer to Table 30-3.In which years is this economy operating at full employment?
A) 2008 only
B) 2009 only
C) 2010 only
D) 2008 and 2012
E) 2009 and 2015
Correct Answer:

Verified
Correct Answer:
Verified
Related Questions
Q31: The total amount of unemployment in the
Q32: If the actual unemployment rate is equal
Q60: If labour markets had perfectly flexible wages,as
Q61: The labour market in the diagram below
Q62: The labour market in the diagram below
Q63: The table below shows the percentage of
Q69: The NAIRU is likely to be affected
Q70: Which of the following statements best explains
Q79: Which of the following policies could the
Q84: Involuntary unemployment in a labour market is