Multiple Choice
The table below shows the percentage of the labour force accounted for by males and females over a two-decade period.Assume that real GDP is equal to potential in each of the given years.
% of Labour Force
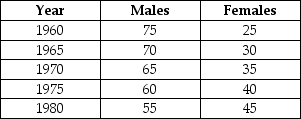 TABLE 30-4
-Refer to Table 30-4.Suppose that for each year listed the unemployment rate among males is 5% while it is 7% among females.What is the economy's NAIRU in 1960?
A) 5.0%
B) 5.5%
C) 5.6%
D) 5.7%
E) 5.8%
Correct Answer:

Verified
Correct Answer:
Verified
Q31: The total amount of unemployment in the
Q44: Suppose the official rate of unemployment reported
Q58: The labour market in the diagram below
Q60: If labour markets had perfectly flexible wages,as
Q61: The labour market in the diagram below
Q62: The labour market in the diagram below
Q65: The table below shows real GDP,potential GDP
Q69: The NAIRU is likely to be affected
Q79: Which of the following policies could the
Q84: Involuntary unemployment in a labour market is