Multiple Choice
The table below shows real GDP,potential GDP and the unemployment rate for a hypothetical economy.
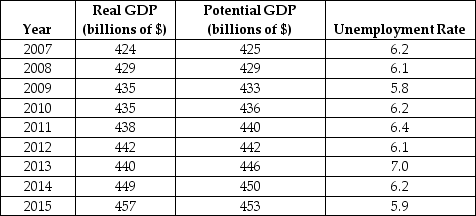 TABLE 30-3
-Refer to Table 30-3.The variations in the unemployment rate between 2007 and 2015 are likely due to variations in
A) the NAIRU.
B) frictional unemployment.
C) structural unemployment.
D) potential output.
E) the output gap.
Correct Answer:

Verified
Correct Answer:
Verified
Q25: When the growth rate of the labour
Q51: Which of the following would be the
Q77: The economy in the diagram below begins
Q80: Suppose we know the following information about
Q81: The table below shows the percentage of
Q83: The table below provides hypothetical unemployment,employment,and labour
Q84: The economy in the diagram below begins
Q85: Suppose the official rate of unemployment reported
Q96: Market-clearing theories of the labour market assume
Q117: The normal turnover of workers and the