Multiple Choice
The table below shows the percentage of the labour force accounted for by males and females over a two-decade period.Assume that real GDP is equal to potential in each of the given years.
% of Labour Force
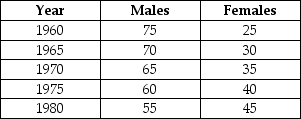 TABLE 30-4
-Refer to Table 30-4.Suppose that for each year listed the unemployment rate among males is 5% while it is 7% among females.What is the economy's NAIRU in 1975?
A) 5.0%
B) 5.5%
C) 5.6%
D) 5.7%
E) 5.8%
Correct Answer:

Verified
Correct Answer:
Verified
Q25: When the growth rate of the labour
Q51: Which of the following would be the
Q76: A likely consequence of firms paying "efficiency
Q77: The economy in the diagram below begins
Q82: The table below shows real GDP,potential GDP
Q83: The table below provides hypothetical unemployment,employment,and labour
Q84: The economy in the diagram below begins
Q85: Suppose the official rate of unemployment reported
Q96: Market-clearing theories of the labour market assume
Q117: The normal turnover of workers and the