Multiple Choice
The diagram below shows the demand and supply curves for refrigerators in Canada. 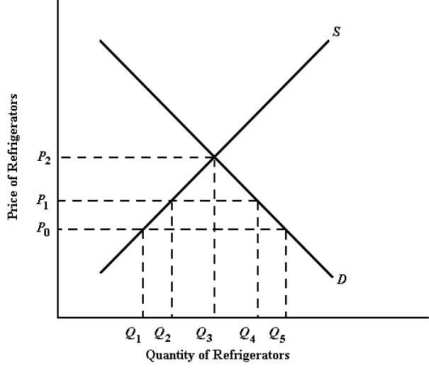 FIGURE 33-1
-Refer to Figure 33-1.Suppose P0 is the world price and Canada imports refrigerators.Suppose the Canadian government then responds to political pressure from domestic refrigerator manufacturers and imposes a tariff high enough that all imports are eliminated.As a result of this tariff,the price and quantity of refrigerators in Canada will be,respectively,
A) P0 and Q1.
B) P0 and Q5.
C) P1 and Q2.
D) P1 and Q3.
E) P2 and Q3.
Correct Answer:

Verified
Correct Answer:
Verified
Q68: Suppose Canada reduces a tariff on imported
Q75: The diagram below shows the domestic demand
Q76: The effect of a tariff on a
Q77: Suppose Canada imposes a 20% tariff on
Q80: The diagram below shows the demand and
Q83: A country that implements a voluntary export
Q84: The diagram below shows the domestic demand
Q88: Consider the following statement: "With unemployment at
Q107: Countervailing duties are a method of trade
Q116: The General Agreement on Tariffs and Trade