Multiple Choice
The diagram below shows the demand and supply curves for refrigerators in Canada. 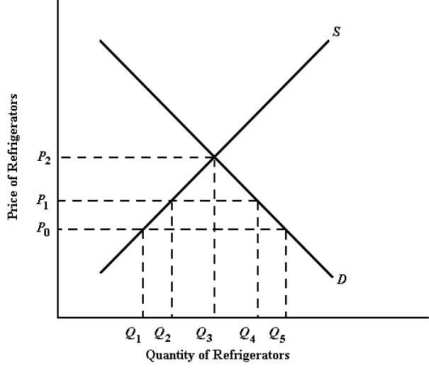 FIGURE 33-1
-Refer to Figure 33-1.If we compare the effect of an import tariff with the effect of an import quota in this market,both of which cause the Canadian price to increase by the same amount,the major difference between the two policies is
A) the quota does not directly reduce the quantity whereas the tariff does.
B) the tariff raises revenue for the government whereas the quota benefits foreign producers.
C) the tariff raises revenue for the protected producers whereas the quota benefits the government.
D) the tariff does not directly affect the price consumers pay whereas the quota does.
E) the tariff directly affects the price consumers pay whereas the quota has neither direct nor indirect price effects.
Correct Answer:

Verified
Correct Answer:
Verified
Q68: Suppose Canada reduces a tariff on imported
Q75: The diagram below shows the domestic demand
Q76: The effect of a tariff on a
Q77: Suppose Canada imposes a 20% tariff on
Q79: The diagram below shows the demand and
Q83: A country that implements a voluntary export
Q84: The diagram below shows the domestic demand
Q85: If a country is small in world
Q88: Consider the following statement: "With unemployment at
Q107: Countervailing duties are a method of trade