Multiple Choice
The following graph illustrates ________. 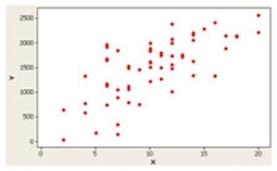
A) a positive or direct relationship
B) a negative or inverse relationship
C) no relationship
D) a distribution for a single variable
Correct Answer:

Verified
Correct Answer:
Verified
Related Questions
Q25: A box plot shows the skewness of
Q26: A dot plot can be used to
Q27: What is the possible range of values
Q28: What statistics are needed to draw a
Q29: A sample of experienced typists revealed that
Q31: Which of the following is NOT a
Q32: The following graph is a _. <img
Q33: The following graph is _. <img src="https://d2lvgg3v3hfg70.cloudfront.net/TB2636/.jpg"
Q34: In the following table, <img src="https://d2lvgg3v3hfg70.cloudfront.net/TB2636/.jpg" alt="In
Q35: The median of a sample will always