Multiple Choice
The following graph is ________. 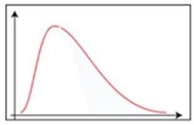
A) positively skewed
B) negatively skewed
C) symmetric
D) uniformly distributed
Correct Answer:

Verified
Correct Answer:
Verified
Related Questions
Q28: What statistics are needed to draw a
Q29: A sample of experienced typists revealed that
Q30: The following graph illustrates _. <img src="https://d2lvgg3v3hfg70.cloudfront.net/TB2636/.jpg"
Q31: Which of the following is NOT a
Q32: The following graph is a _. <img
Q34: In the following table, <img src="https://d2lvgg3v3hfg70.cloudfront.net/TB2636/.jpg" alt="In
Q35: The median of a sample will always
Q36: A student scored in the 85<sup>th</sup> percentile
Q37: The following table is a _. <img
Q38: A dot plot is useful for showing