Multiple Choice
The following table is a ________. 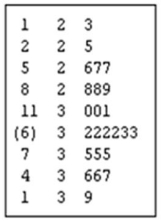
A) dot plot
B) stem-and-leaf display
C) box plot
D) contingency table
Correct Answer:

Verified
Correct Answer:
Verified
Related Questions
Q32: The following graph is a _. <img
Q33: The following graph is _. <img src="https://d2lvgg3v3hfg70.cloudfront.net/TB2636/.jpg"
Q34: In the following table, <img src="https://d2lvgg3v3hfg70.cloudfront.net/TB2636/.jpg" alt="In
Q35: The median of a sample will always
Q36: A student scored in the 85<sup>th</sup> percentile
Q38: A dot plot is useful for showing
Q39: The 50th percentile of a distribution is
Q40: Pearson's coefficient of skewness is a measure
Q41: A dot plot shows _.<br>A)the general shape
Q42: A stem-and-leaf display includes the following row: