Multiple Choice
Which of the lines is a graph of the profit at maturity of writing a call option on €62,500 with a strike price of $1.20 = €1.00 and an option premium of $3,125? 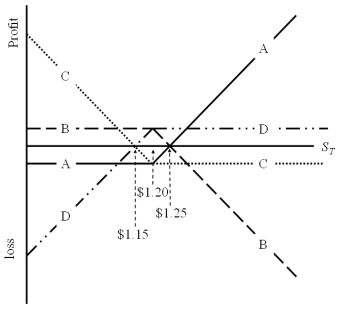
A) A
B) B
C) C
D) D
Correct Answer:

Verified
Correct Answer:
Verified
Related Questions
Q1: Find the Black-Scholes price of a six-month
Q39: Calculate the hedge ratio.
Q53: Consider a 1-year call option written on
Q73: For European currency options written on euro
Q74: Exercise of a currency futures option results
Q74: If the call finishes out-of-the-money what is
Q83: Draw the tree for a put option
Q85: Suppose you observe the following 1-year interest
Q88: Which of the following is correct?<br>A)The value
Q91: For European currency options written on euro