Multiple Choice
The figure below depicts the short-run market equilibrium in a perfectly competitive market and the cost curves for a representative firm in that market. Assume that all firms in this market have identical cost curves. 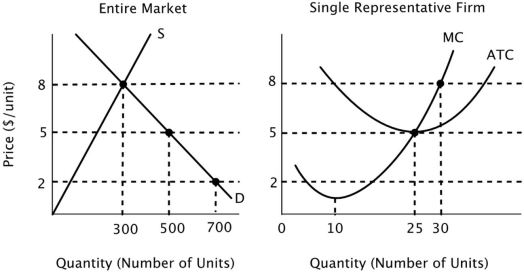 The long-run market equilibrium quantity in this industry is:
A) 300.
B) 500.
C) 700.
D) more than 700.
Correct Answer:

Verified
Correct Answer:
Verified
Q12: Angelina Jolie's economic rent from starring in
Q78: If it is possible to make a
Q79: According to the theory of the invisible
Q106: Economic theory assumes that a firm's goal
Q117: Last year Christine worked as a consultant.
Q120: A price ceiling that is set above
Q130: The figure below shows the supply and
Q132: The figure below shows the supply and
Q137: Suppose a small island nation imports sugar
Q151: Suppose several United States software design companies