Multiple Choice
The figure below shows the supply and demand curves for oranges in Smallville. 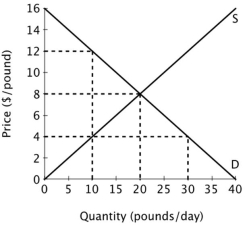 At a price of $4 per pound there will be an excess ______ of ______ pounds of oranges per day.
A) supply; 20
B) demand; 30
C) supply; 10
D) demand; 20
Correct Answer:

Verified
Correct Answer:
Verified
Q7: Pat used to work as an aerobics
Q12: Angelina Jolie's economic rent from starring in
Q47: Which of the following describes a surplus-enhancing
Q106: Economic theory assumes that a firm's goal
Q117: Last year Christine worked as a consultant.
Q127: Refer to the figure below. <img src="https://d2lvgg3v3hfg70.cloudfront.net/TB3719/.jpg"
Q128: Suppose a small island nation imports sugar
Q129: Suppose a small island nation imports sugar
Q132: The figure below shows the supply and
Q135: The figure below depicts the short-run market