Multiple Choice
The figure below shows the supply and demand curves for oranges in Smallville. 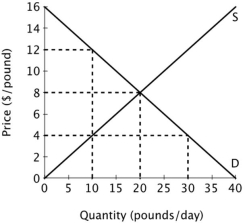 What is the marginal cost of producing the tenth pound of oranges?
A) $2
B) $3
C) $4
D) $5
Correct Answer:

Verified
Correct Answer:
Verified
Related Questions
Q29: Subsidies are most likely to:<br>A)reduce consumer surplus.<br>B)increase
Q35: Pat used to work as an aerobics
Q36: If the owners of a business are
Q49: Suppose that in an effort to help
Q56: Refer to the table below. Suppose
Q57: Refer to the figure below. <img src="https://d2lvgg3v3hfg70.cloudfront.net/TB3719/.jpg"
Q61: Assume that all firms in this industry
Q98: In a free market economy, the decisions
Q135: In an industry with free entry and
Q143: A situation is efficient if it is:<br>A)possible