Multiple Choice
The figure below shows the supply and demand curves for oranges in Smallville. 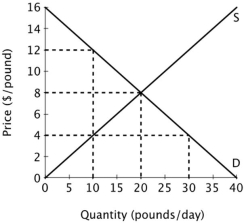 When this market is in equilibrium, total economic surplus is ______ per day.
A) $0
B) $80
C) $160
D) $320
Correct Answer:

Verified
Correct Answer:
Verified
Related Questions
Q41: Economic profit is equal to:<br>A)accounting profit plus
Q70: Assume that all firms in this industry
Q71: Refer to the table below. An
Q73: Assume that all firms in this industry
Q74: Assume that all firms in this industry
Q78: Assume that all firms in this industry
Q79: Refer to the table below. At
Q80: The statement, "If a deal is too
Q86: If you were to start your own
Q115: Economic rent is:<br>A)the amount people pay for