Multiple Choice
Refer to the figure below. From this graph, you can infer that paper production: 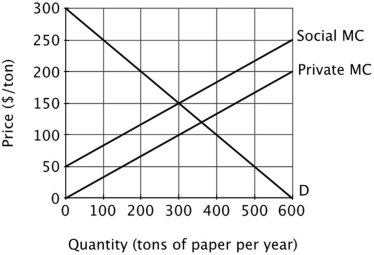
A) generates no externalities at quantities less than 300 tons per day.
B) generates an external cost of $50 per ton per year.
C) generates an external cost of $150 per ton per year.
D) should be prohibited.
Correct Answer:

Verified
Correct Answer:
Verified
Q12: Refer to the figure below. Private incentives
Q13: This graph shows the marginal cost and
Q14: Suppose that a vaccine is developed for
Q18: Refer to the figure below. The deadweight
Q19: Consider two restaurants located next door
Q21: Refer to the figure below. This graph
Q59: Early settlers in the town of Dry
Q77: Which of the following is most likely
Q115: If an activity generates a positive externality,
Q145: If either the production or consumption of