Multiple Choice
The figure shows a standard normal N(0, 1) distribution. Find the z value for the shaded area. 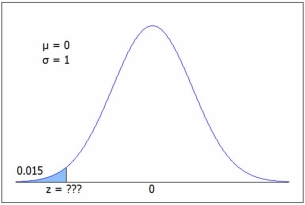 C.2 gives P(z < -2.17) = .0150 or use Excel =NORM.S.INV(0.015) = -2.17.
A) -2.17
B) -2.09
C) -1.99
D) -1.94
Correct Answer:

Verified
Correct Answer:
Verified
Related Questions
Q30: If the mean waiting time for the
Q31: Regarding continuous probability distributions, which statement is
Q32: On average, 15 minutes elapse between discoveries
Q33: Exam scores were normal in MIS 200.
Q34: Which probability model is most appropriate to
Q36: The exponential distribution is continuous and the
Q37: The figure shows a normal N(400, 23)
Q38: In Melanie's Styling Salon, the time to
Q39: The probability is .80 that a standard
Q40: The figure shows a normal N(400, 23)