Multiple Choice
The figure shows a normal N(400, 23) distribution. Find the x value for the shaded area. 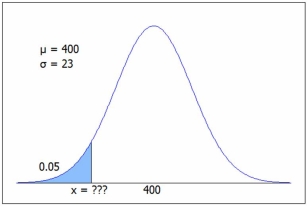 C.2 we get P(z < -1.645) = .05, so x = µ + zσ = 400 - 1.645(23) = 362.2, or from Excel =NORM.INV(0.05,400,23) = 362.2.
A) 379.1
B) 362.2
C) 355.7
D) 347.6
Correct Answer:

Verified
Correct Answer:
Verified
Related Questions
Q35: The figure shows a standard normal N(0,
Q36: The exponential distribution is continuous and the
Q37: The figure shows a normal N(400, 23)
Q38: In Melanie's Styling Salon, the time to
Q39: The probability is .80 that a standard
Q41: The lengths of brook trout caught in
Q42: In Melanie's Styling Salon, the time to
Q43: The lengths of brook trout caught in
Q44: A random variable X is best described
Q45: A machine dispenses water into a glass.