True/False
Because most data values are on the left, we would say that this dot plot (burglary rates per 100,000 persons in 350 U.S. cities) shows a distribution that is skewed to the left (negatively skewed). 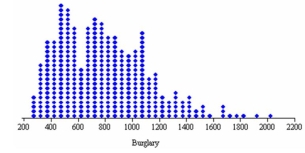
Correct Answer:

Verified
Correct Answer:
Verified
Related Questions
Q56: Briefly list strengths and weaknesses of this
Q56: Briefly list strengths and weaknesses of this
Q57: The graph below illustrates which deceptive technique?
Q59: Which is a not a characteristic of
Q60: Log scales are common because most people
Q62: Here are advertised prices of 23 used
Q63: It is possible to construct a histogram
Q64: Students were given a take-home statistics assignment
Q65: Scatter plots are:<br>A)useful in visualizing trends over
Q66: The zero origin rule may be waived