Multiple Choice
The graph below illustrates which deceptive technique? 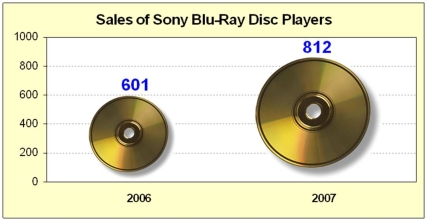
A) Poor Y axis scale
B) Area trick
C) Unclear grid lines
D) Dramatic title
Correct Answer:

Verified
Correct Answer:
Verified
Related Questions
Q52: Below is a sorted stem-and-leaf diagram
Q53: Which data would be suitable for a
Q55: A dot plot would be useful in
Q56: Briefly list strengths and weaknesses of this
Q56: Briefly list strengths and weaknesses of this
Q56: Briefly list strengths and weaknesses of this
Q59: Which is a not a characteristic of
Q60: Log scales are common because most people
Q61: Because most data values are on the
Q62: Here are advertised prices of 23 used