Multiple Choice
The figure shows the speedometer readings as a car comes to a stop.Solve graphically for the acceleration at t = 7.0 s. 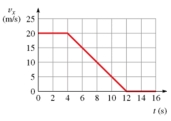
A) 2.5 m/s2
B) - 2.5 m/s2
C) - 2.0 m/s2
D) 2.0 m/s2
Correct Answer:

Verified
Correct Answer:
Verified
Related Questions
Q21: A model airplane is flying north at
Q22: The figure shows the graph of v<sub>x</sub>
Q23: A river flows toward the East at
Q24: An object starts from rest and moves
Q25: An ant travels 30 cm east,25
Q28: An airplane is flying in horizontal flight
Q29: A river flows toward the East
Q30: An ant crawls in a straight line
Q32: A car travels for 140 km at
Q67: A runner starts from rest and with