menu-iconExamlexExamLexServices

Discover

Ask a Question
  1. All Topics
  2. Topic
    Physics & Astronomy
  3. Study Set
    College Physics
  4. Exam
    Exam 3: Acceleration and Newtons Second Law of Motion
  5. Question
    The Figure Shows the Graph of V<sub>x</sub> Versus Time for an Object
Solved

The Figure Shows the Graph of Vx Versus Time for an Object

Question 22

Question 22

Multiple Choice

The figure shows the graph of vx versus time for an object moving along the x-axis.What is the acceleration at t = 7.0 s?
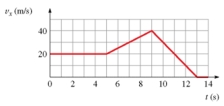
 The figure shows the graph of v<sub>x</sub> versus time for an object moving along the x-axis.What is the acceleration at t = 7.0 s?   A)  4.0 m/s<sup>2</sup> B)  5.0 m/s<sup>2</sup> C)  0.5 m/s<sup>2</sup> D)  0.4 m/s<sup>2</sup>


A) 4.0 m/s2
B) 5.0 m/s2
C) 0.5 m/s2
D) 0.4 m/s2

Correct Answer:

verifed

Verified

Unlock this answer now
Get Access to more Verified Answers free of charge

Related Questions

Q3: The velocity of a boat with respect

Q17: The figure is a graph of v<sub>x</sub>(t)for

Q18: Two masses are suspended by cord that

Q21: A baseball is pitched,reaching the batter with

Q23: A river flows toward the East at

Q24: An object starts from rest and moves

Q25: An ant travels 30 cm east,25

Q27: The figure shows the speedometer readings as

Q37: A car starting from rest travels a

Q67: A runner starts from rest and with

Examlex

ExamLex

About UsContact UsPerks CenterHomeschoolingTest Prep

Work With Us

Campus RepresentativeInfluencers

Links

FaqPricingChrome Extension

Download The App

Get App StoreGet Google Play

Policies

Privacy PolicyTerms of ServiceHonor CodeCommunity Guidelines

Scan To Download

qr-code

Copyright © (2025) ExamLex LLC.

Privacy PolicyTerms Of ServiceHonor CodeCommunity Guidelines