Multiple Choice
The following graph depicts demand. 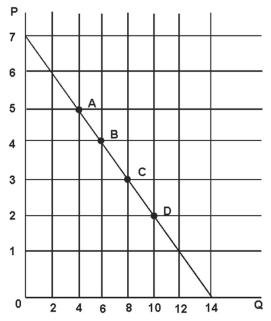
Refer to the figure above.The price elasticity of demand at point A is:
A) 5/2.
B) 5/8.
C) 2/5.
D) 8/5.
Correct Answer:

Verified
Correct Answer:
Verified
Related Questions
Q8: If most consumer goods and services are
Q58: At the price of $20 each,demand for
Q59: The following graph depicts demand. <img src="https://d2lvgg3v3hfg70.cloudfront.net/TB3715/.jpg"
Q60: For OutBack Steakhouse,seating capacity is limited in
Q61: The price elasticity of demand for a
Q62: The demand for a good is elastic
Q64: If cross price elasticity is positive but
Q65: The cross-price elasticity for bread and potatoes
Q66: Suppose the price P on a given
Q67: Suppose that a new drug has been