Multiple Choice
The following graph depicts demand. 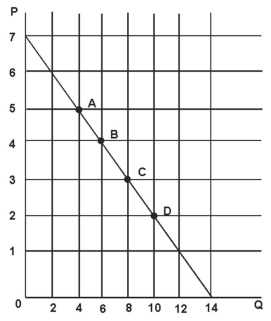
Refer to the figure above.The price elasticity of demand at point D is:
A) 5/2.
B) 1/2.
C) 2/5.
D) 2.
Correct Answer:

Verified
Correct Answer:
Verified
Related Questions
Q54: If the price of textbooks increases by
Q55: Suppose that the demand for electricity has
Q56: Lakeville is a small community that completely
Q57: Suppose that there is only one small
Q58: At the price of $20 each,demand for
Q60: For OutBack Steakhouse,seating capacity is limited in
Q61: The price elasticity of demand for a
Q62: The demand for a good is elastic
Q63: The following graph depicts demand. <img src="https://d2lvgg3v3hfg70.cloudfront.net/TB3715/.jpg"
Q64: If cross price elasticity is positive but