Multiple Choice
Assume that the graphs show a competitive market for the product stated in the question. 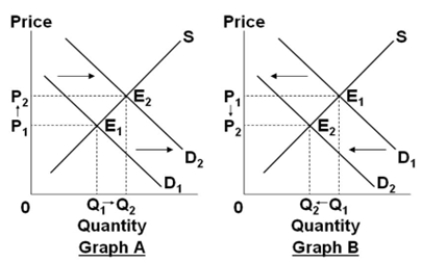
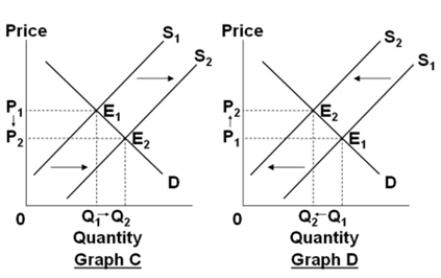 Select the graph above that best shows the change in the market for gasoline, when the price of oil, which is used to produce gasoline, increases because of reduced production by major oil-producing nations.
A) Graph A
B) Graph B
C) Graph C
D) Graph D
Correct Answer:

Verified
Correct Answer:
Verified
Q19: If we observe that the price of
Q53: Which would best explain a decrease in
Q151: A decrease in the price of multi-touch
Q192: A market is in equilibrium<br>A) provided there
Q308: An increase in demand for oil along
Q312: If producers must obtain higher prices than
Q315: Which of the following would best be
Q316: (Advanced analysis) The demand for commodity X
Q319: Assume that the graphs show a competitive
Q335: A headline reads, "Lumber Prices Up Sharply."