Multiple Choice
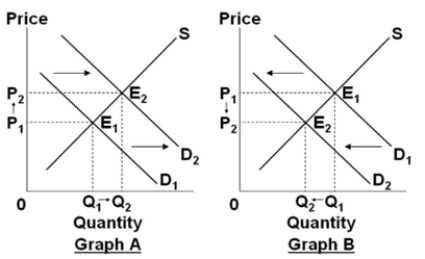
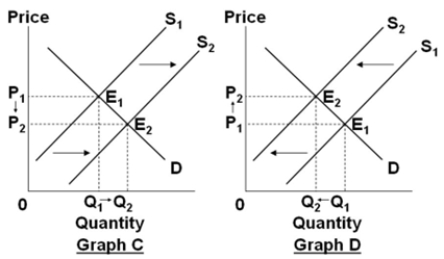
Assume that the graphs show a competitive market for the product stated in the question. 
 Select the graph that best shows the change in the market for Florida oranges, when a major frost damages the orange crop in California.
A) Graph A
B) Graph B
C) Graph C
D) Graph D
Correct Answer:

Verified
Correct Answer:
Verified
Related Questions
Q19: If we observe that the price of
Q53: Which would best explain a decrease in
Q117: If the demand for electronic readers and
Q151: A decrease in the price of multi-touch
Q192: A market is in equilibrium<br>A) provided there
Q308: An increase in demand for oil along
Q315: Which of the following would best be
Q316: (Advanced analysis) The demand for commodity X
Q317: Assume that the graphs show a competitive
Q323: In moving along a supply curve, which