Multiple Choice
The following figure shows the effect of a price ceiling in the market for yams.The market was initially in equilibrium at price P2 and quantity B.
Figure 10-1 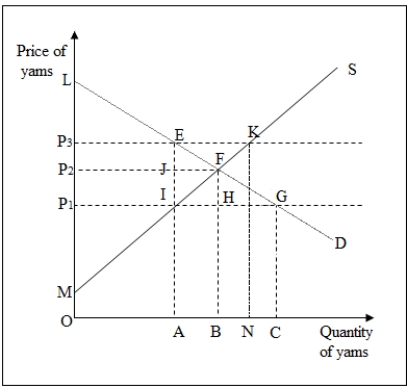
-Refer to Figure 10-1.The total surplus at the initial point of equilibrium,F,is given by _____.
A) LFP2
B) LFGP1
C) LFM
D) LFIP1
Correct Answer:

Verified
Correct Answer:
Verified
Q17: Consider two increasing-cost competitive industries (A and
Q18: The following figure shows the domestic U.S.market
Q40: A rent control has been imposed on
Q43: Suppose an increasing-cost competitive industry is in
Q48: The U.S.airline industry,prior to deregulation,was characterized by
Q49: In the short run,an excise tax placed
Q61: When a price ceiling is imposed in
Q62: Given that quotas benefit producers,who are few
Q65: Is the outcome of a competitive market
Q70: Issuing a fixed number of licenses to