Multiple Choice
The following figure shows the domestic U.S.market for bananas and the global market for bananas.The domestic supply curve is given by SUPPLYUS.With free trade,the equilibrium output in the U.S.market is Q.The import quota imposed by the government is equal to 0A.
Figure 10-5 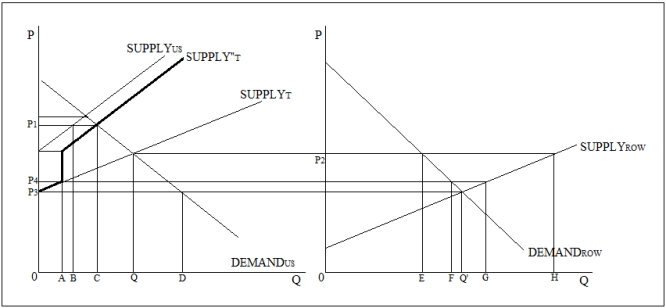
-Refer to Figure 10-5.After the import quota has been imposed,the equilibrium price in the domestic market changes to _____.
A) P1
B) P2
C) P3
D) P4
Correct Answer:

Verified
Correct Answer:
Verified
Q16: Suppose the demand and supply for apples
Q17: Consider two increasing-cost competitive industries (A and
Q19: Rent controls in the rental housing market:<br>A)will
Q22: The following figure shows the effect of
Q48: The U.S.airline industry,prior to deregulation,was characterized by
Q55: If a commodity has a(n)_,a greater share
Q57: Which of the following is true of
Q61: When a price ceiling is imposed in
Q65: Is the outcome of a competitive market
Q70: Issuing a fixed number of licenses to