Multiple Choice
The following figure shows the effect of a price ceiling in the market for yams.The market was initially in equilibrium at price P2 and quantity B.
Figure 10-1 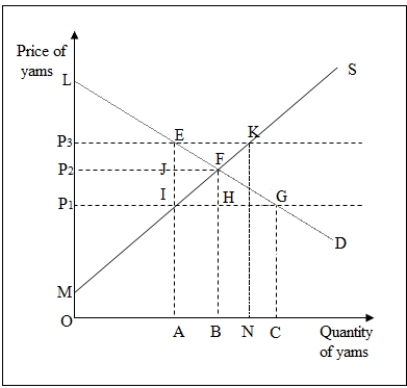
-In Figure 10-1,what is the quantity of output produced after the imposition of the price ceiling at P1?
A) OA
B) OB
C) OC
D) ON
Correct Answer:

Verified
Correct Answer:
Verified
Q3: In which of the following cases is
Q5: Suppose the government limits the number of
Q54: The area under the supply curve represents
Q57: The following figure shows the effect of
Q58: Suppose the demand for some good
Q59: The following figure shows the domestic U.S.market
Q59: The equilibrium of a competitive industry is:<br>A)equitable
Q61: The following figure shows the effect of
Q64: The following figure shows the demand and
Q65: Consider two increasing cost competitive industries (A