Multiple Choice
The following figure shows the effect of a price ceiling in the market for yams.The market was initially in equilibrium at price P2 and quantity B.
Figure 10-1 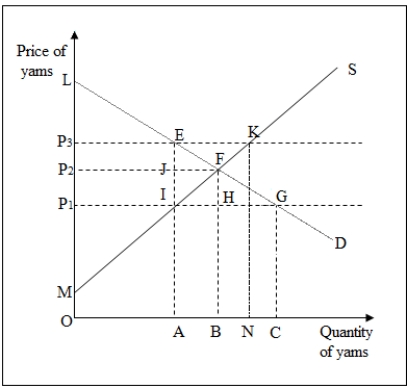
-In Figure 10-1,the net change in total surplus due to a price ceiling set at P3 is _____.
A) EKF
B) P3KFP2
C) 0
D) EFJ
Correct Answer:

Verified
Correct Answer:
Verified
Q3: In which of the following cases is
Q52: Which of the following correctly identifies the
Q53: The following figure shows the intersection of
Q54: The following figure shows the intersection of
Q55: The following figure shows the domestic U.S.market
Q58: Suppose the demand for some good
Q59: The following figure shows the domestic U.S.market
Q61: The following figure shows the effect of
Q62: The following figure shows the effect of
Q66: Which of the following strengthens the possibility