Multiple Choice
The following figure shows the effect of a price ceiling in the market for yams.The market was initially in equilibrium at price P2 and quantity B.
Figure 10-1 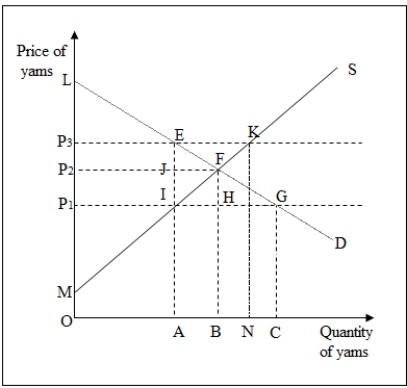
-Refer to Figure 10-1.The change in aggregate producer surplus due to a price ceiling set at P1 is area _____.
A) -EFI
B) EFJ - P2JIP1
C) -P2FIP1
D) P1IM
Correct Answer:

Verified
Correct Answer:
Verified
Q2: A given per-unit excise tax will increase
Q2: The following figure shows the demand and
Q8: The following figure shows the effect of
Q11: Suppose the following supply and demand curves
Q12: The following figure shows the effect of
Q14: Suppose there is a city which licenses
Q29: If a commodity has a(n)_,a greater share
Q67: How do price ceilings in the rental
Q74: A per-unit excise tax on a single
Q76: The long-run supply curve in a constant-cost