Multiple Choice
The following figure shows the effect of a price ceiling in the market for yams.The market was initially in equilibrium at price P2 and quantity B.
Figure 10-1 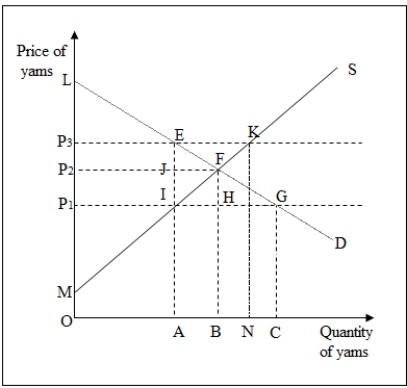
-In Figure 10-1,the aggregate producer surplus after a price ceiling is set at P1 is area _____.
A) MFP2
B) MIEP3
C) MIJP2
D) MIP1
Correct Answer:

Verified
Correct Answer:
Verified
Q7: The following figure shows the effect of
Q8: The following figure shows the effect of
Q11: Suppose the following supply and demand curves
Q16: Suppose the demand and supply for apples
Q17: Consider two increasing-cost competitive industries (A and
Q19: Rent controls in the rental housing market:<br>A)will
Q29: If a commodity has a(n)_,a greater share
Q55: If a commodity has a(n)_,a greater share
Q57: Which of the following is true of
Q74: A per-unit excise tax on a single