Multiple Choice
The figure given below shows the demand and supply of unskilled labor that determines the equilibrium wage rate in the labor market.The minimum wage rate at $5.15 is higher than the equilibrium wage rate at $4. 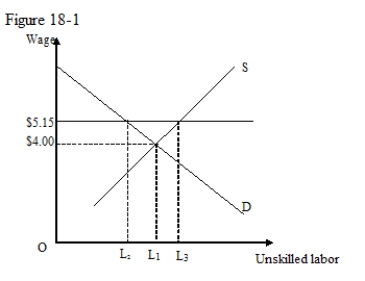
-Refer to Figure 18-1.The increase in the number of workers looking for work in this market due to the imposition of a $5.15 minimum wage is _____.
A) L1L3
B) L2L3
C) OL1
D) L2L1
Correct Answer:

Verified
Correct Answer:
Verified
Q8: Consider an industry that was initially employing
Q15: According to the Fair Labor Standards Act,which
Q19: Consider a labor market where the demand
Q23: In a labor market characterized by a
Q45: The figure given below shows the demand
Q58: Which of the following is not a
Q62: Which of the following is an argument
Q64: What determines who bears the burden of
Q71: The aggregate supply curve of hours of
Q72: Which of the following is not likely