Multiple Choice
The figure given below shows the demand and supply curves of labor.A per-unit tax imposed on the wage income of the employees shifts the supply curve of labor upward. 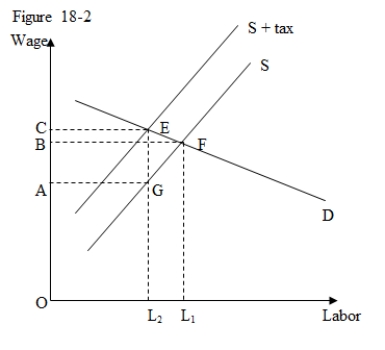
-Refer to Figure 18-2.The total revenue collected by the government from the per-unit tax is represented by the area:
A) BFL1O.
B) CEL2O.
C) ABFG.
D) ACEG.
Correct Answer:

Verified
Correct Answer:
Verified
Q8: Consider an industry that was initially employing
Q15: According to the Fair Labor Standards Act,which
Q19: Consider a labor market where the demand
Q23: In a labor market characterized by a
Q43: Which of the following factors determines the
Q46: The figure given below shows the demand
Q58: Which of the following is not a
Q62: Which of the following is an argument
Q64: What determines who bears the burden of
Q71: The aggregate supply curve of hours of