Essay
FIGURE 10-6 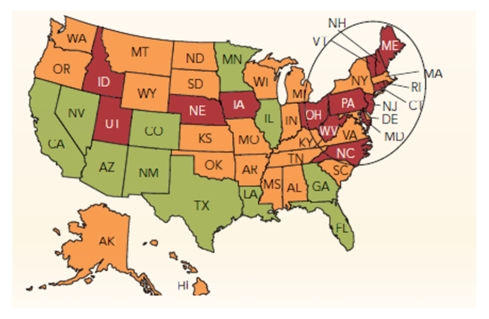
-In the Marketing dashboards shown in Figure 10-6 above, "green" indicates an annual growth rate that is greater than 10%; "orange" signifies an annual growth rate of between 0%-10%; and "red" represents a decline or negative annual growth rate.If an organization's 2010 sales for entire U.S.were $50 million and its 2009 U.S.sales were $30 million.The annual % of sales change is 150%.Identify three possible marketing actions you would consider to reverse the decline in annual sales growth in the "red" states.
Correct Answer:

Verified
Marketing is often grappling with sales ...View Answer
Unlock this answer now
Get Access to more Verified Answers free of charge
Correct Answer:
Verified
View Answer
Unlock this answer now
Get Access to more Verified Answers free of charge
Q89: <img src="https://d2lvgg3v3hfg70.cloudfront.net/TB2495/.jpg" alt=" Figure 10-1 -According
Q257: _ are items that become part of
Q258: With respect to price, which of the
Q259: Lufthansa and Singapore Airlines ads show travelers
Q261: Which of the following would most likely
Q263: To maximize profits, service providers use tools
Q264: What do a landscaping service, an automated
Q265: The addition of Clorox II bleach to
Q266: In terms of brand loyalty, consumers are
Q267: In marketing, a(n) _ is a thought