Multiple Choice
FIGURE 8-20 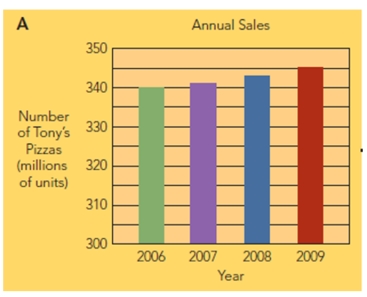
-Figure 8-22 above shows that
A) Tony's Pizza sales to households with 5 or more people increased over the period 2006 to 2009.
B) households with 5 or more people bought the least Tony's Pizza over the period 2006 to 2009.
C) between 2006 to 2007, as single people married and became two person households, the increase in sales was greater than the expected 200% change.
D) Tony's Pizza sales to households with 2 people have remained relatively steady from 2006 to 2009.
E) the changes from year to year are really not significant since overall sales have continued to increase.
Correct Answer:

Verified
Correct Answer:
Verified
Q228: A(n) _ forecast involves starting with the
Q229: A _ is a sample of consumers
Q230: What is the marketing research term for
Q231: After defining the problem, the next step
Q232: FIGURE 8-20 <img src="https://d2lvgg3v3hfg70.cloudfront.net/TB4418/.jpg" alt="FIGURE 8-20
Q234: Data mining refers to<br>A)any form of electronically
Q235: The first step of the marketing research
Q236: A special kind of individual interview in
Q237: During the marketing research process, _ are
Q238: The fourth step of the marketing research