Multiple Choice
FIGURE 8-23 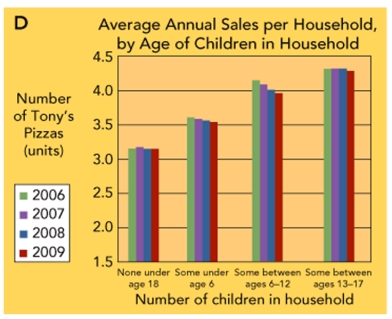
-Figure 8-23 above shows that
A) Tony's Pizza sales to households with some children between the age of 13 and 17 decreased significantly over the period 2006-2009.
B) Tony's Pizza sales to households with children between the ages of 6 to 12 decreased over the period 2006-2009.
C) Tony's Pizza sales to single-person households have remained relatively steady from 2006-2009.
D) Tony's Pizza sales to households with no children under 18 have declined from 2006-2009.
E) there is not a significant enough difference between age groups that would warrant a marketing action at this time.
Correct Answer:

Verified
Correct Answer:
Verified
Q124: A marketing research approach that uses a
Q125: Primary data refer to<br>A)facts and figures that
Q126: Marketing researchers use tracking studies immediately before
Q127: The Belsen interview is a means of
Q128: One test of whether marketing research should
Q130: In _, the marketing researcher tries to
Q131: Figure 8-23 above, shows average annual sales
Q133: FIGURE 8-8 <img src="https://d2lvgg3v3hfg70.cloudfront.net/TB4418/.jpg" alt="FIGURE 8-8
Q134: The final stage in the five-step marketing
Q250: Obtaining primary and secondary data would take