Multiple Choice
FIGURE 2-3 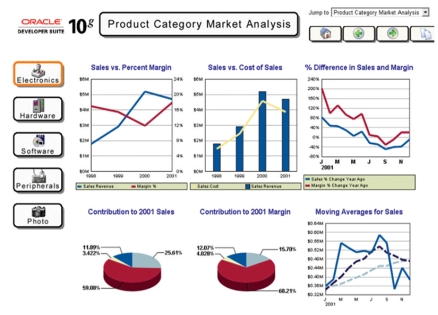
-According to Figure 2-3 above, during which year was sales revenue the largest?
A) 1998
B) 1999
C) 2000
D) 2001
E) The sales were flat.
Correct Answer:

Verified
Correct Answer:
Verified
Q30: In recent years, many large firms have
Q31: Mission refers to<br>A)the target goal set by
Q32: A tool that helps a firm search
Q33: Which of the following statements regarding diversification
Q34: Designing a car is expensive and time-consuming
Q36: FIGURE 2-1 <img src="https://d2lvgg3v3hfg70.cloudfront.net/TB4418/.jpg" alt="FIGURE 2-1
Q37: FIGURE 2-7 <img src="https://d2lvgg3v3hfg70.cloudfront.net/TB4418/.jpg" alt="FIGURE 2-7
Q38: The Boston Consulting Group's business portfolio analysis
Q39: The _ for American Red Cross is
Q40: FIGURE 2-12 <img src="https://d2lvgg3v3hfg70.cloudfront.net/TB4418/.jpg" alt="FIGURE 2-12