Multiple Choice
FIGURE 2-10 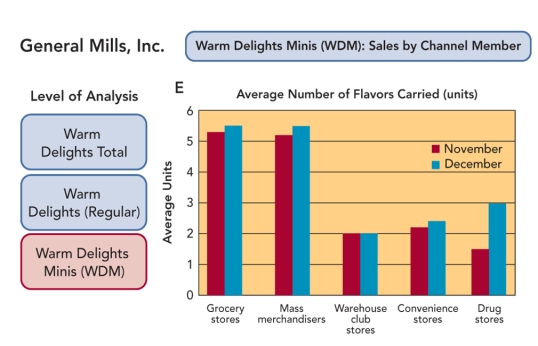
-The bar graph in Figure 2-10 above for drug stores would most likely cause marketers to
A) put more product into drugstores and remove product from club stores.
B) find out why customers prefer more flavors in drug stores in December and exploit that information.
C) reduce the choices to keep drug stores more in line with other distribution outlets.
D) investigate shopping preferences of customers amongst different channel members.
E) take corrective actions that would allow drug stores to sell as much as grocery stores.
Correct Answer:

Verified
Correct Answer:
Verified
Q47: Ben & Jerry's mission contains three interrelated
Q48: In keeping with its mission, Ben &
Q49: The Boston Consulting Group (BCG) business portfolio
Q50: An organization's special capabilities, including skills, technology,
Q51: Today's organizations must be visionary-that is, they
Q53: Marketing metric refers to<br>A)a measure of the
Q54: In the Boston Consulting Group (BCG) model
Q55: Several years ago, Black & Decker purchased
Q56: In the 20th century railroads may have
Q57: The second phase of the strategic marketing