Multiple Choice
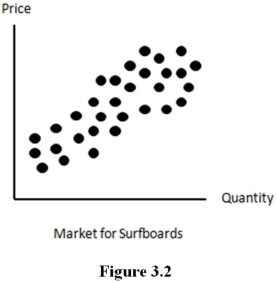
-The scatter diagram in figure suggests that _______ relationship likely exists between the price and quantity supplied of surfboards.
A) a positive linear
B) a negative linear
C) a quadratic
D) no linear
Correct Answer:

Verified
Correct Answer:
Verified
Q14: A counselor working with teenagers is
Q15: Suppose that you construct the histogram in
Q16: a.If the correlation coefficient between two random
Q17: <img src="https://d2lvgg3v3hfg70.cloudfront.net/TB4093/.jpg" alt=" -The scatter diagram
Q18: Suppose you have collected the data
Q20: The standard deviation of a distribution provides
Q21: In your own words,describe the potential benefits
Q22: The median is the<br>A)middle number in an
Q23: The correlation coefficient is<br>A)must be positive.<br>B)the square
Q24: An outlier is<br>A)a data point that falls