Essay
Suppose that you construct the histogram in Figure 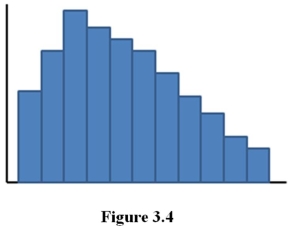
What conclusions would you draw about the data? Explain.
Correct Answer:

Verified
Because the median of the dist...View Answer
Unlock this answer now
Get Access to more Verified Answers free of charge
Correct Answer:
Verified
View Answer
Unlock this answer now
Get Access to more Verified Answers free of charge
Q10: When is the median most appropriate for
Q11: If a data set is skewed then<br>A)the
Q12: The covariance<br>A)measures the linear relationship between two
Q13: Suppose that a data set contains 275
Q14: A counselor working with teenagers is
Q16: a.If the correlation coefficient between two random
Q17: <img src="https://d2lvgg3v3hfg70.cloudfront.net/TB4093/.jpg" alt=" -The scatter diagram
Q18: Suppose you have collected the data
Q19: <img src="https://d2lvgg3v3hfg70.cloudfront.net/TB4093/.jpg" alt=" -The scatter diagram
Q20: The standard deviation of a distribution provides