Essay
You are given the following probability distribution for XYZ common stock's returns during the next year,which are assumed to be normally distributed.Show all work below,and complete the following: 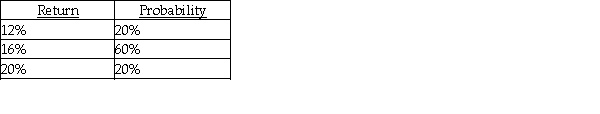 a.Calculate the standard deviation of the returns,and round to the nearest one-half percent. b.Draw a graphical representation of XYZ's normal distribution below (ye old bell-shaped curve).LABEL THE AXES OF THE GRAPH OR THE FOLLOWING RESULTS WILL BE MEANINGLESS.Using your result in part A for the standard deviation (rounded to the nearest one-half percent)explain and indicate on the graph,the probability that XYZ will return more than 13.5%,assuming a normal distribution.
Correct Answer:

Verified
GRAPH: a.Exp.Return = (.12 × .2)+ (.16 ×...View Answer
Unlock this answer now
Get Access to more Verified Answers free of charge
Correct Answer:
Verified
View Answer
Unlock this answer now
Get Access to more Verified Answers free of charge
Q3: Beta represents the average movement of a
Q34: Because risk is measured by variability of
Q41: According to the CAPM,for each unit of
Q46: You are considering the three securities listed
Q47: An investor currently holds the following portfolio:
Q48: If you hold a portfolio made up
Q70: An all-stock portfolio is more risky than
Q85: A well-diversified portfolio includes investments in 50
Q93: The CAPM designates the risk-return tradeoff existing
Q104: Total risk equals systematic risk plus unsystematic