menu-iconExamlexExamLexServices

Discover

Ask a Question
  1. All Topics
  2. Topic
    Statistics
  3. Study Set
    Statistics for Management and Economics
  4. Exam
    Exam 3: Graphical Descriptive Techniques 2
  5. Question
    The Graph Below Represents a Line Graph
Solved

The Graph Below Represents a Line Graph

Question 74

Question 74

True/False

The graph below represents a line graph. The graph below represents a line graph.

Correct Answer:

verifed

Verified

Unlock this answer now
Get Access to more Verified Answers free of charge

Related Questions

Q69: A histogram represents interval data.

Q70: The line chart below shows tomato prices

Q71: Which of the following statements about histograms

Q72: A popular method of creating distorted impressions

Q73: An economics professor wants to study the

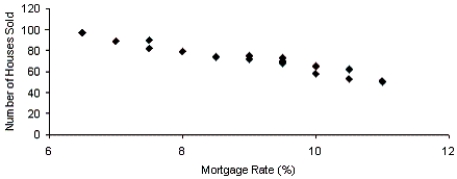
Q75: The relationship between two interval variables is

Q76: Which of the following is the method

Q77: The two most important characteristics to examine

Q78: Credit Hours The College of Business at

Q79: Fifty two truck buyers were asked to

Examlex

ExamLex

About UsContact UsPerks CenterHomeschoolingTest Prep

Work With Us

Campus RepresentativeInfluencers

Links

FaqPricingChrome Extension

Download The App

Get App StoreGet Google Play

Policies

Privacy PolicyTerms of ServiceHonor CodeCommunity Guidelines

Scan To Download

qr-code

Copyright © (2025) ExamLex LLC.

Privacy PolicyTerms Of ServiceHonor CodeCommunity Guidelines