True/False
The line chart below shows cucumber prices fluctuated from $2.00 per pound to over $4.50 per pound during the year. 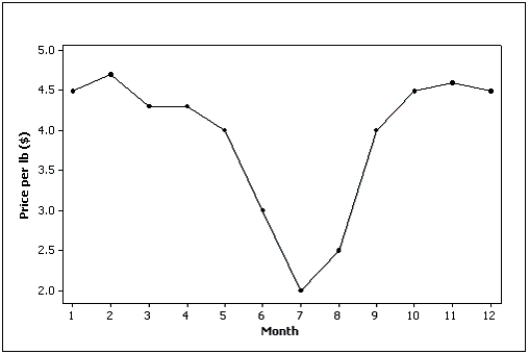
Correct Answer:

Verified
Correct Answer:
Verified
Related Questions
Q88: Briefly discuss the difference between cross-sectional data
Q89: Which of the following characteristics apply to
Q90: An individual's income depends somewhat on their
Q91: In its 2000 report,a company presented the
Q92: Electronics Company At a meeting of
Q94: What are the two most important characteristics
Q95: Slopes and trends in a line chart
Q96: The number of houses sold in Miami
Q97: Home Care Data are collected on
Q98: Observations that are taken during successive points