Essay
In its 2000 report,a company presented the following data regarding its sales (in millions of dollars),and net income (in millions of dollars). 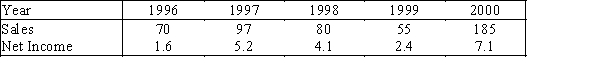 The bar chart below was used to present these data.
 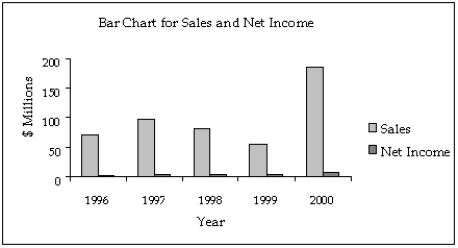 Assume that you are an unscrupulous statistician and want to make the data appear more positive than they really are.Redraw the graph by being selective about which years to include,getting the desired effect.
Correct Answer:

Verified
An unscrupulous statistician could choos...View Answer
Unlock this answer now
Get Access to more Verified Answers free of charge
Correct Answer:
Verified
View Answer
Unlock this answer now
Get Access to more Verified Answers free of charge
Q86: Which of the following statements describes a
Q87: Possible methods of creating distorted impressions with
Q88: Briefly discuss the difference between cross-sectional data
Q89: Which of the following characteristics apply to
Q90: An individual's income depends somewhat on their
Q92: Electronics Company At a meeting of
Q93: The line chart below shows cucumber prices
Q94: What are the two most important characteristics
Q95: Slopes and trends in a line chart
Q96: The number of houses sold in Miami