Multiple Choice
What type of graph depicts the data below? 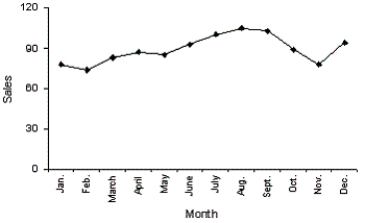
A) A line chart
B) A histogram
C) A dot plot
D) A bar chart
Correct Answer:

Verified
Correct Answer:
Verified
Related Questions
Q146: If when one variable increases the other
Q147: Data for calories and salt content (milligrams
Q148: A bar chart can be made to
Q149: Insurance Company A representative from a local
Q150: The intervals (classes)in a histogram are equally
Q151: In a histogram a(n)_ class is the
Q153: Which of the following describes the shape
Q154: <img src="https://d2lvgg3v3hfg70.cloudfront.net/TB4388/.jpg" alt=" Admission to ER
Q155: We create a frequency distribution for interval
Q156: The two most important characteristics revealed by