True/False
A professor examines the relationship between minutes studying and exam score (out of 200 points)for a random sample of his students.The scatter diagram is shown below.It appears that study time has somewhat of a positive linear relationship with exam score. 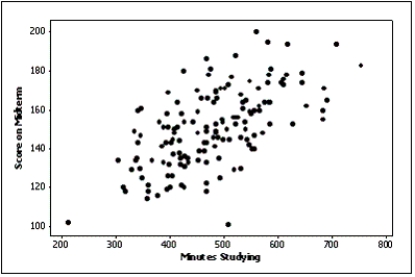
Correct Answer:

Verified
Correct Answer:
Verified
Q110: Briefly explain the difference between correlation and
Q111: Time-series data are often graphically depicted how?<br>A)Bar
Q112: Which of the following statements illustrates graphical
Q113: A histogram is said to be _
Q114: {Teachers Ages Narrative} Draw a frequency histogram
Q116: Samantha recorded her amount of exercise time
Q117: The sum of the relative frequencies for
Q118: The effect of making the slope of
Q119: Pie charts only show _,not _.This means
Q120: Which of the following represents a graphical